Important points
- SMA calculates the average closing price of an asset over a set period of time to smooth price data.
- Short-term SMAs react quickly, while long-term SMAs indicate overall trends.
- Traders use SMAs for buy and sell signals and crossover strategies such as golden crosses and death crosses.
- Although the SMA is a lagging indicator, it helps identify trend, support, and resistance levels.
The simple moving average (SMA) is technical analysis An indicator that smoothes price data by calculating the average closing price of an asset over a specified period. Creating lines on the chart that move with each new period of data helps investors understand market trends, support, and resistance levels, making them easier to visualize and interpret.
How does SMA work?
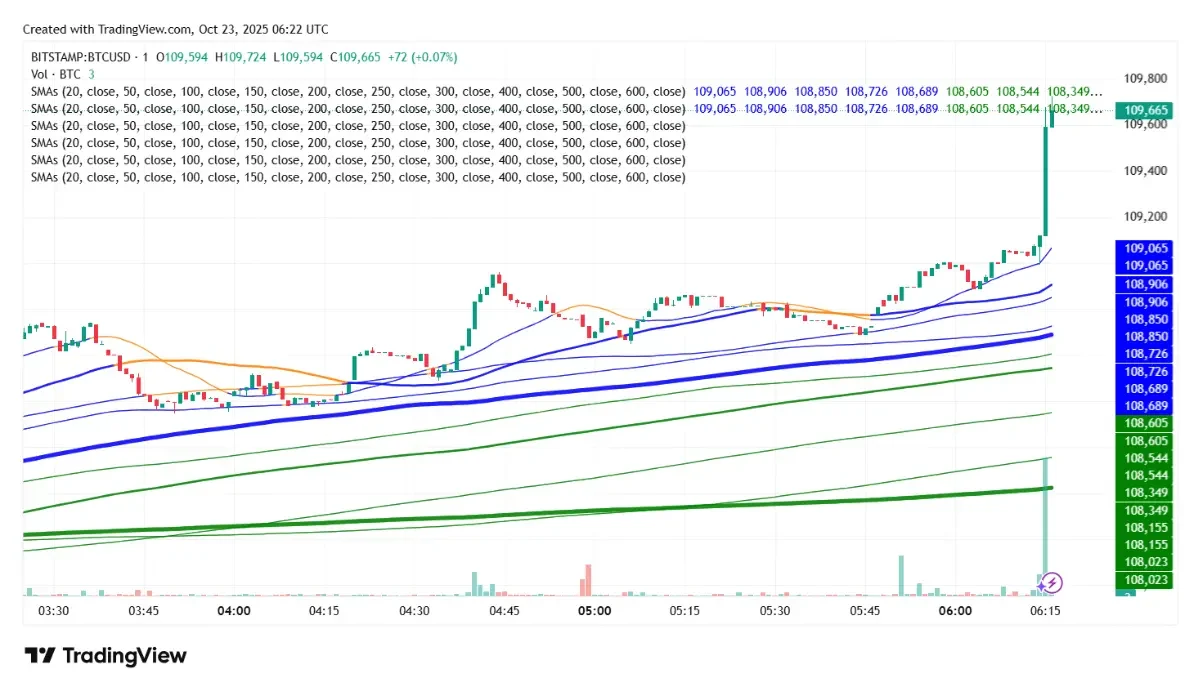
You can calculate the SMA by selecting a period and finding the average closing price during that period. The calculation formula is simple. Add the closing prices for the time frame you are interested in and divide the sum by the number of periods.


Source: TradingView
How to calculate SMA
Suppose you want to calculate the 10-day SMA. The closing prices for each day are $10, $15, $16, $14, $25, $19, $11, $17, $13, and $12. SMA is calculated as follows:
Simple Moving Average (SMA) formula
SMA = (A₁ + A₂ + … + Aₙ) / n
where:
- Aₙ = price of the asset in the period n
- n = total number of periods
A simple moving average calculates the average of an asset’s price over a specified period of time, smoothing price data and helping to identify trends.
SMA = (10 + 12 + 13 + 14 + 15 + 16 + 17 + 11 + 19 + 25) / 10 = 15.2. This means the 10-day SMA is $15.2. As the day progresses, the oldest price is removed and the latest price is added to the calculation, which will fluctuate as prices change.
SMA smoothes price data by identifying short-term fluctuations and highlighting long-term trends. Shorter-term SMAs, such as the 5-day SMA, are more sensitive to price fluctuations than longer-term SMAs, such as the 200-day SMA, which provide a broader view of the overall trend.
The role of SMA in virtual currency trading
SMA is used to identify potential buy and sell signals in cryptocurrency trading. Let’s take Bitcoin as an example. If Bitcoin’s current price is above its 50-day SMA, it signals the beginning of an uptrend. Also, a break below the 50-day SM is likely a continuation of the downtrend and indicates a potential sell signal.
SMA is used in many trading strategies. For example, two SMAs of different lengths can be used to identify crossovers. Traders often use the 50-day SMA or 200-day SMA to find golden crosses. This is a bullish signal that occurs when the short SMA (50 days) crosses the long SMA (200 days). Similarly, there is a bearish signal known as a death cross that occurs when the short SMA falls below the long SMA.
- 50-day SMA exceeds 200-day SMA → Golden Cross (bullish)
- 50-day SMA falls below 200-day SMA → Death cross (bearish)
Although the SMA is easy to calculate, it is not the only tool traders use to predict price flow. There is also. Exponential moving average (EMA)
This adds weight to recent prices, giving them more significance and allowing you to react quickly to price changes. SMA treats all prices equally and provides a smoother price trend analysis, but it lags compared to EMA.
The simple moving average (SMA) is a technical analysis tool widely used by crypto traders and stock market analysts. It is used to identify trends based on price data and a specific time frame. The role of SMA in cryptocurrencies is to predict potential buy and sell signals. SMA can also be used for various other trading strategies.
SMA is a lagging indicator based on historical data. This allows you to react quickly to new prices. However, it can smooth out price fluctuations and provide a clearer picture of trends. Many traders use this to identify support and resistance levels.


