Ethereum is holding firm after a sharp rejection near the $4,500 resistance zone. Price trends remain volatile and indecisive as bulls seek to maintain key support levels as overall market sentiment turns defensive. Although the macro support zone remains intact for now, the recent decline in bullish momentum is clearly visible in both the price structure and RSI movement.
technical analysis
Written by Shayan
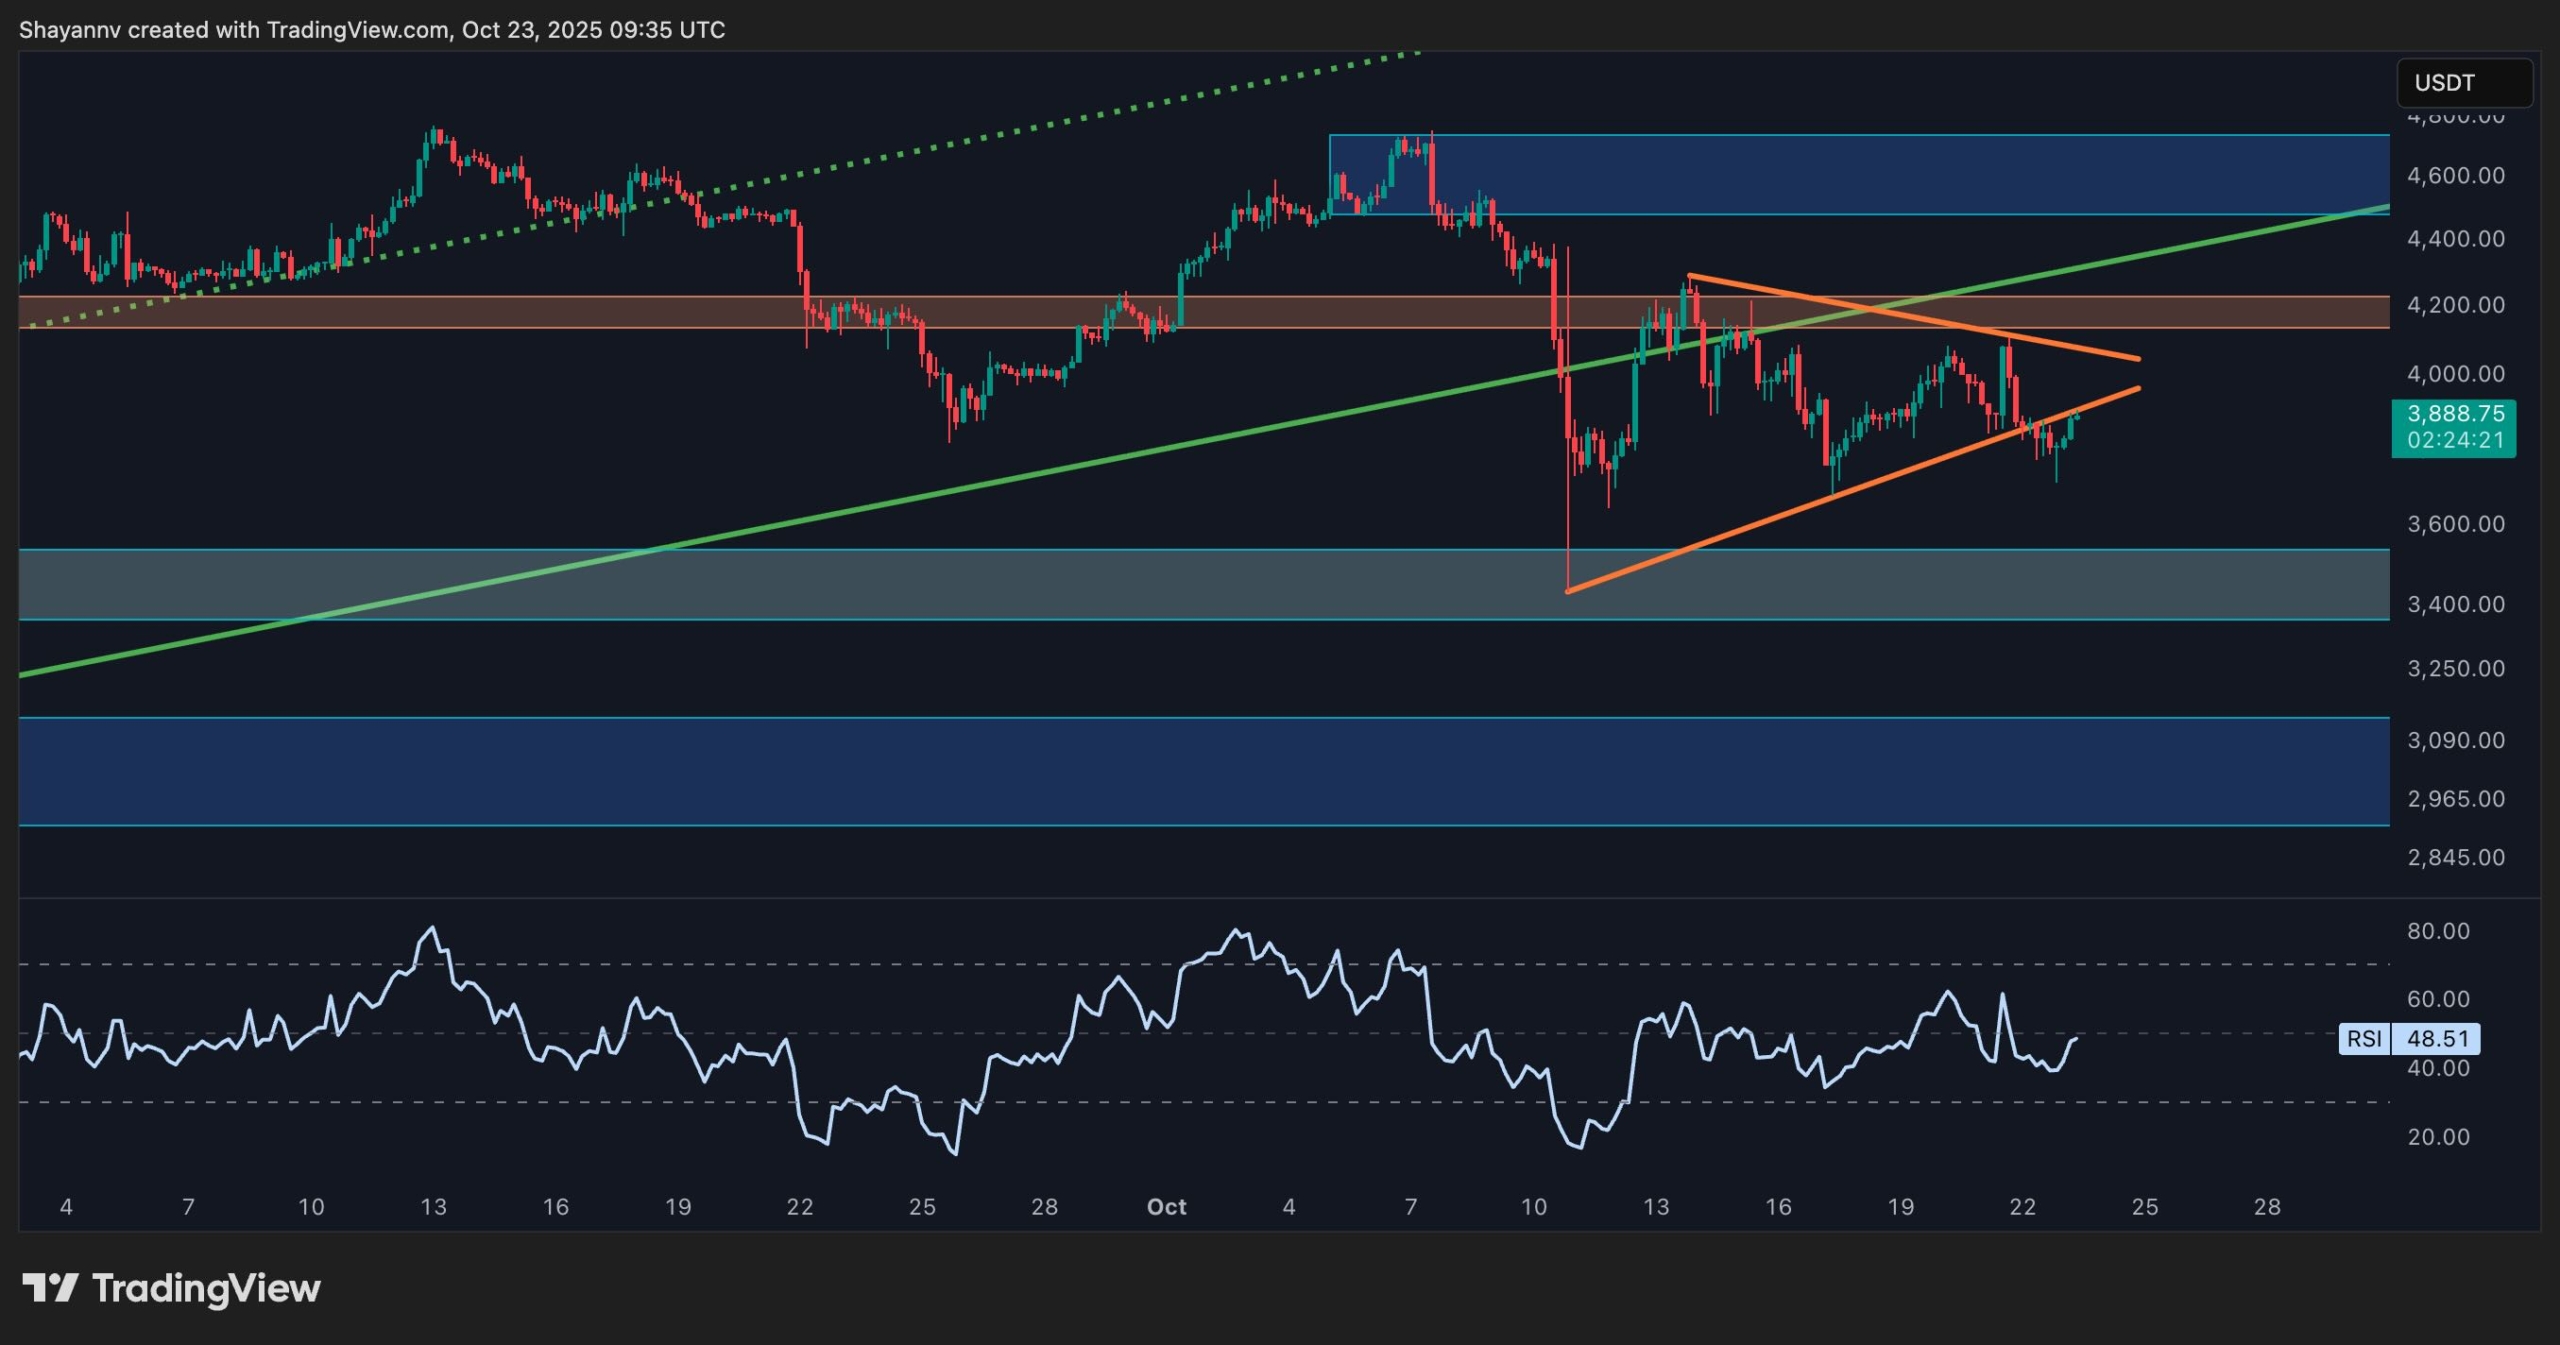
daily chart
The daily structure shows that ETH broke below the ascending parallel channel and lost its recent momentum above $4,400. After failing to sustain the lower trendline and 100-day moving average located near $4,100, the asset is currently hovering just above the $3,500 support zone.
The RSI also remains below 50, suggesting that it still lacks strength. If buyers fail to defend this area, it could head towards the 200-day moving average near the $3,200 level and even the $3,000 demand zone.
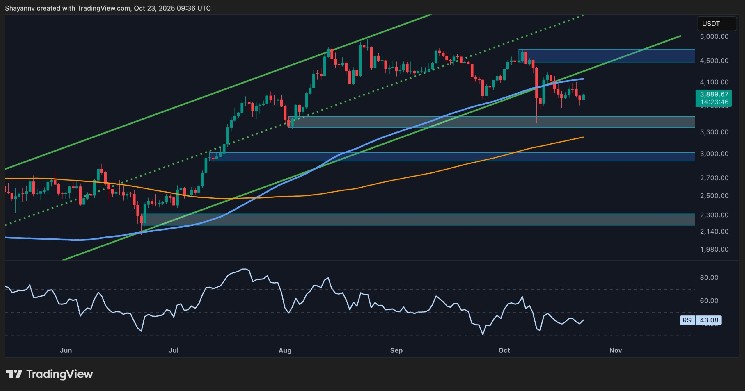
4 hour chart
On the 4-hour time frame, ETH formed a symmetrical triangle just below the major supply zone around $4,200. The asset has broken out of the triangle and is again testing the lower bound. A breakout from this pattern usually leads to a spike in volatility, especially if price is rejected from the channel’s lower trendline.
A breakout above $4,000 could send the price towards the $4,600 resistance, and a breakdown would reveal the $3,500 level. Furthermore, although the RSI has rebounded slightly, there are still no signs of a strong breakout and the near-term outlook remains neutral.
On-chain analysis
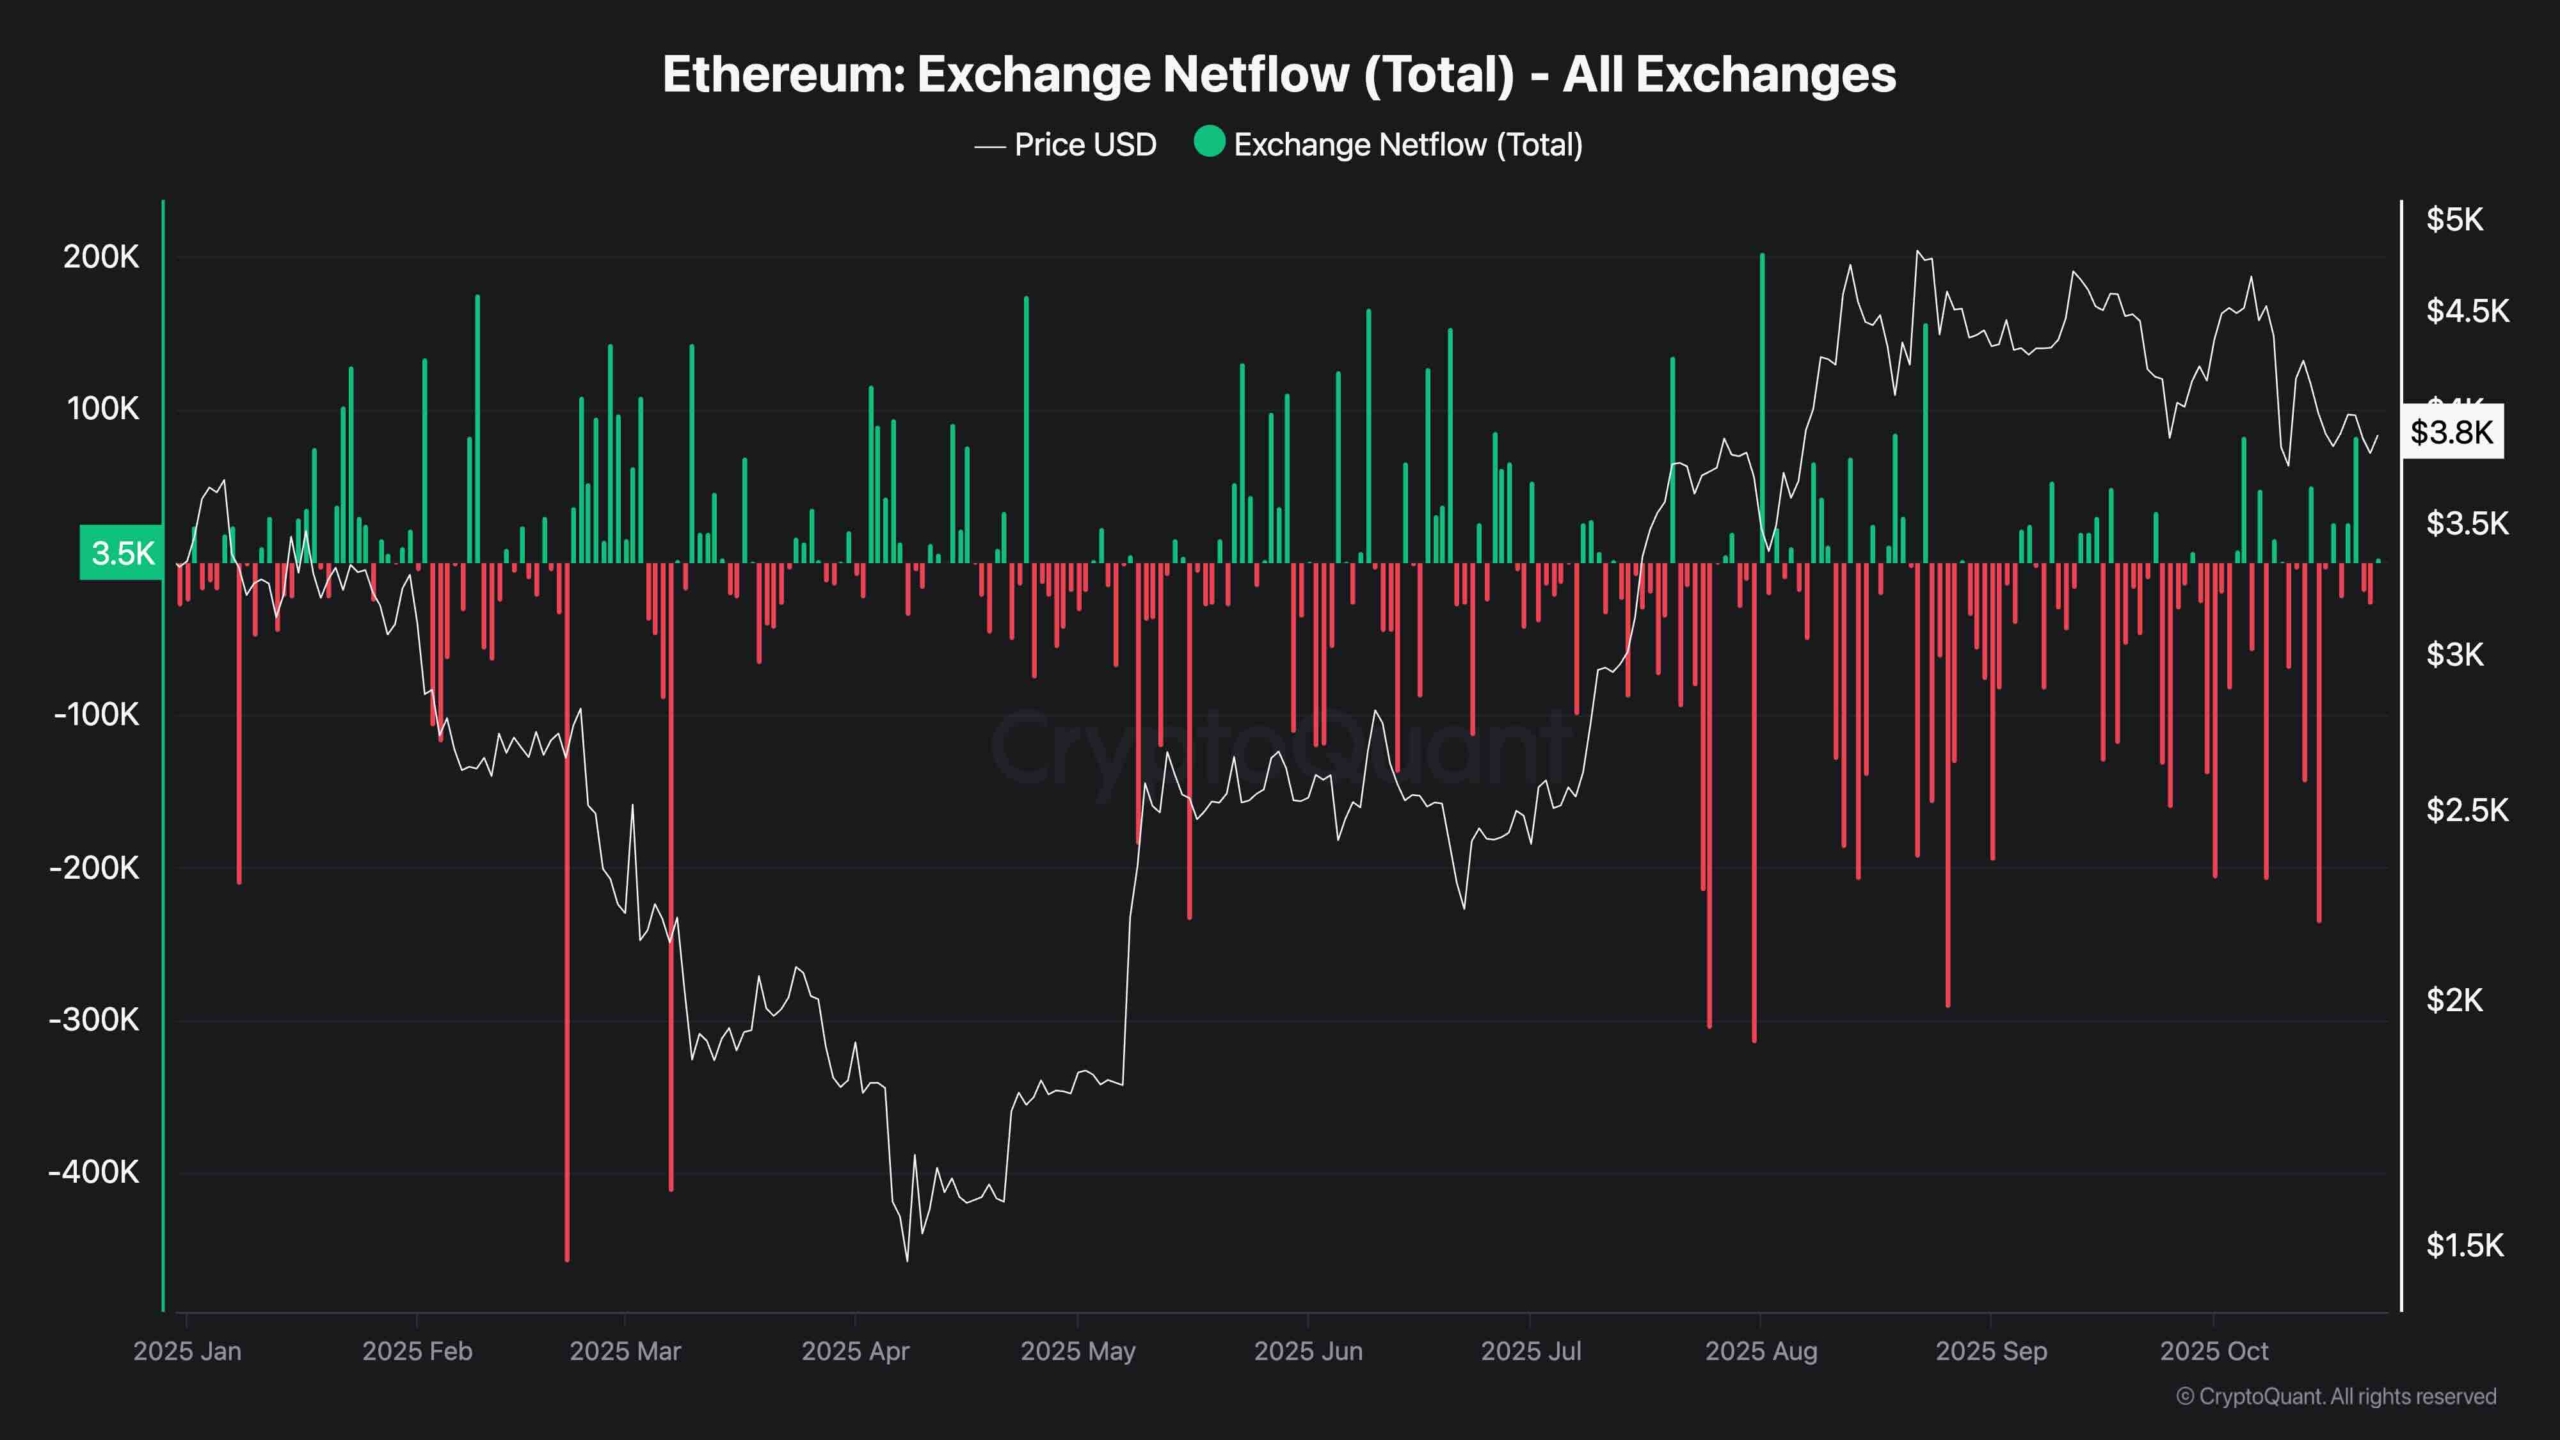
Exchange Netflow
Ethereum netflow data shows a cautious picture. Most days in the past few weeks have shown large outflows from exchanges, suggesting that holders prefer to keep their ETH in private wallets rather than preparing to sell.
However, this has not yet led to a solid continuation in prices, suggesting that accumulation may be occurring during consolidation. Unless outflows continue and panic inflows spike, downside pressure will remain limited.