
Ethereum’s price has entered a bear market after falling more than 20% from this year’s highs as the cryptocurrency tumbles.
summary
- Ethereum price has formed a bullish flag pattern on the weekly chart.
- The Spot ETH ETF recorded over $114 million in inflows last week.
- Technical indicators suggest that the coin will rebound in the short term.
Ethereum (ETH) tokens were trading at $3,895 as of November 2, an increase of 178% from this year’s lows. It has formed a bullish flag pattern, pointing to further gains as exchange-traded fund inflows increase.
Spot Ethereum ETF outperformed Bitcoin (BTC) last week, according to data compiled by SoSoValue. These funds added more than $114 million in inflows after losing more than $243 million the previous week. In contrast, Bitcoin ETFs shed more than $607 million in assets.
The Spot Ethereum ETF has added more than $14.3 billion in inflows since its inception last July. These gains were primarily driven by BlackRock’s ETHA, which currently holds more than $15.15 billion in assets. Other top Ethereum ETFs are from companies like Grayscale, Fidelity, and Bitwise.
You may also like: Pi Network’s price rally isn’t over yet, chart pattern suggests further upside
Top companies have also been accumulating Ethereum over the past few months. According to data from CoinGecko, companies such as BitMine, SharpLink, Bit Digital, and ETHZilla hold over $18.5 billion worth of Ethereum tokens.
Ethereum’s funding rate remains above zero, indicating that investors are optimistic that the future price will be higher than the current one.
Additionally, futures open interest remains stable at over $45 billion despite the continued pullback. Short and long liquidations have receded in the past few weeks.
Ethereum price technical analysis
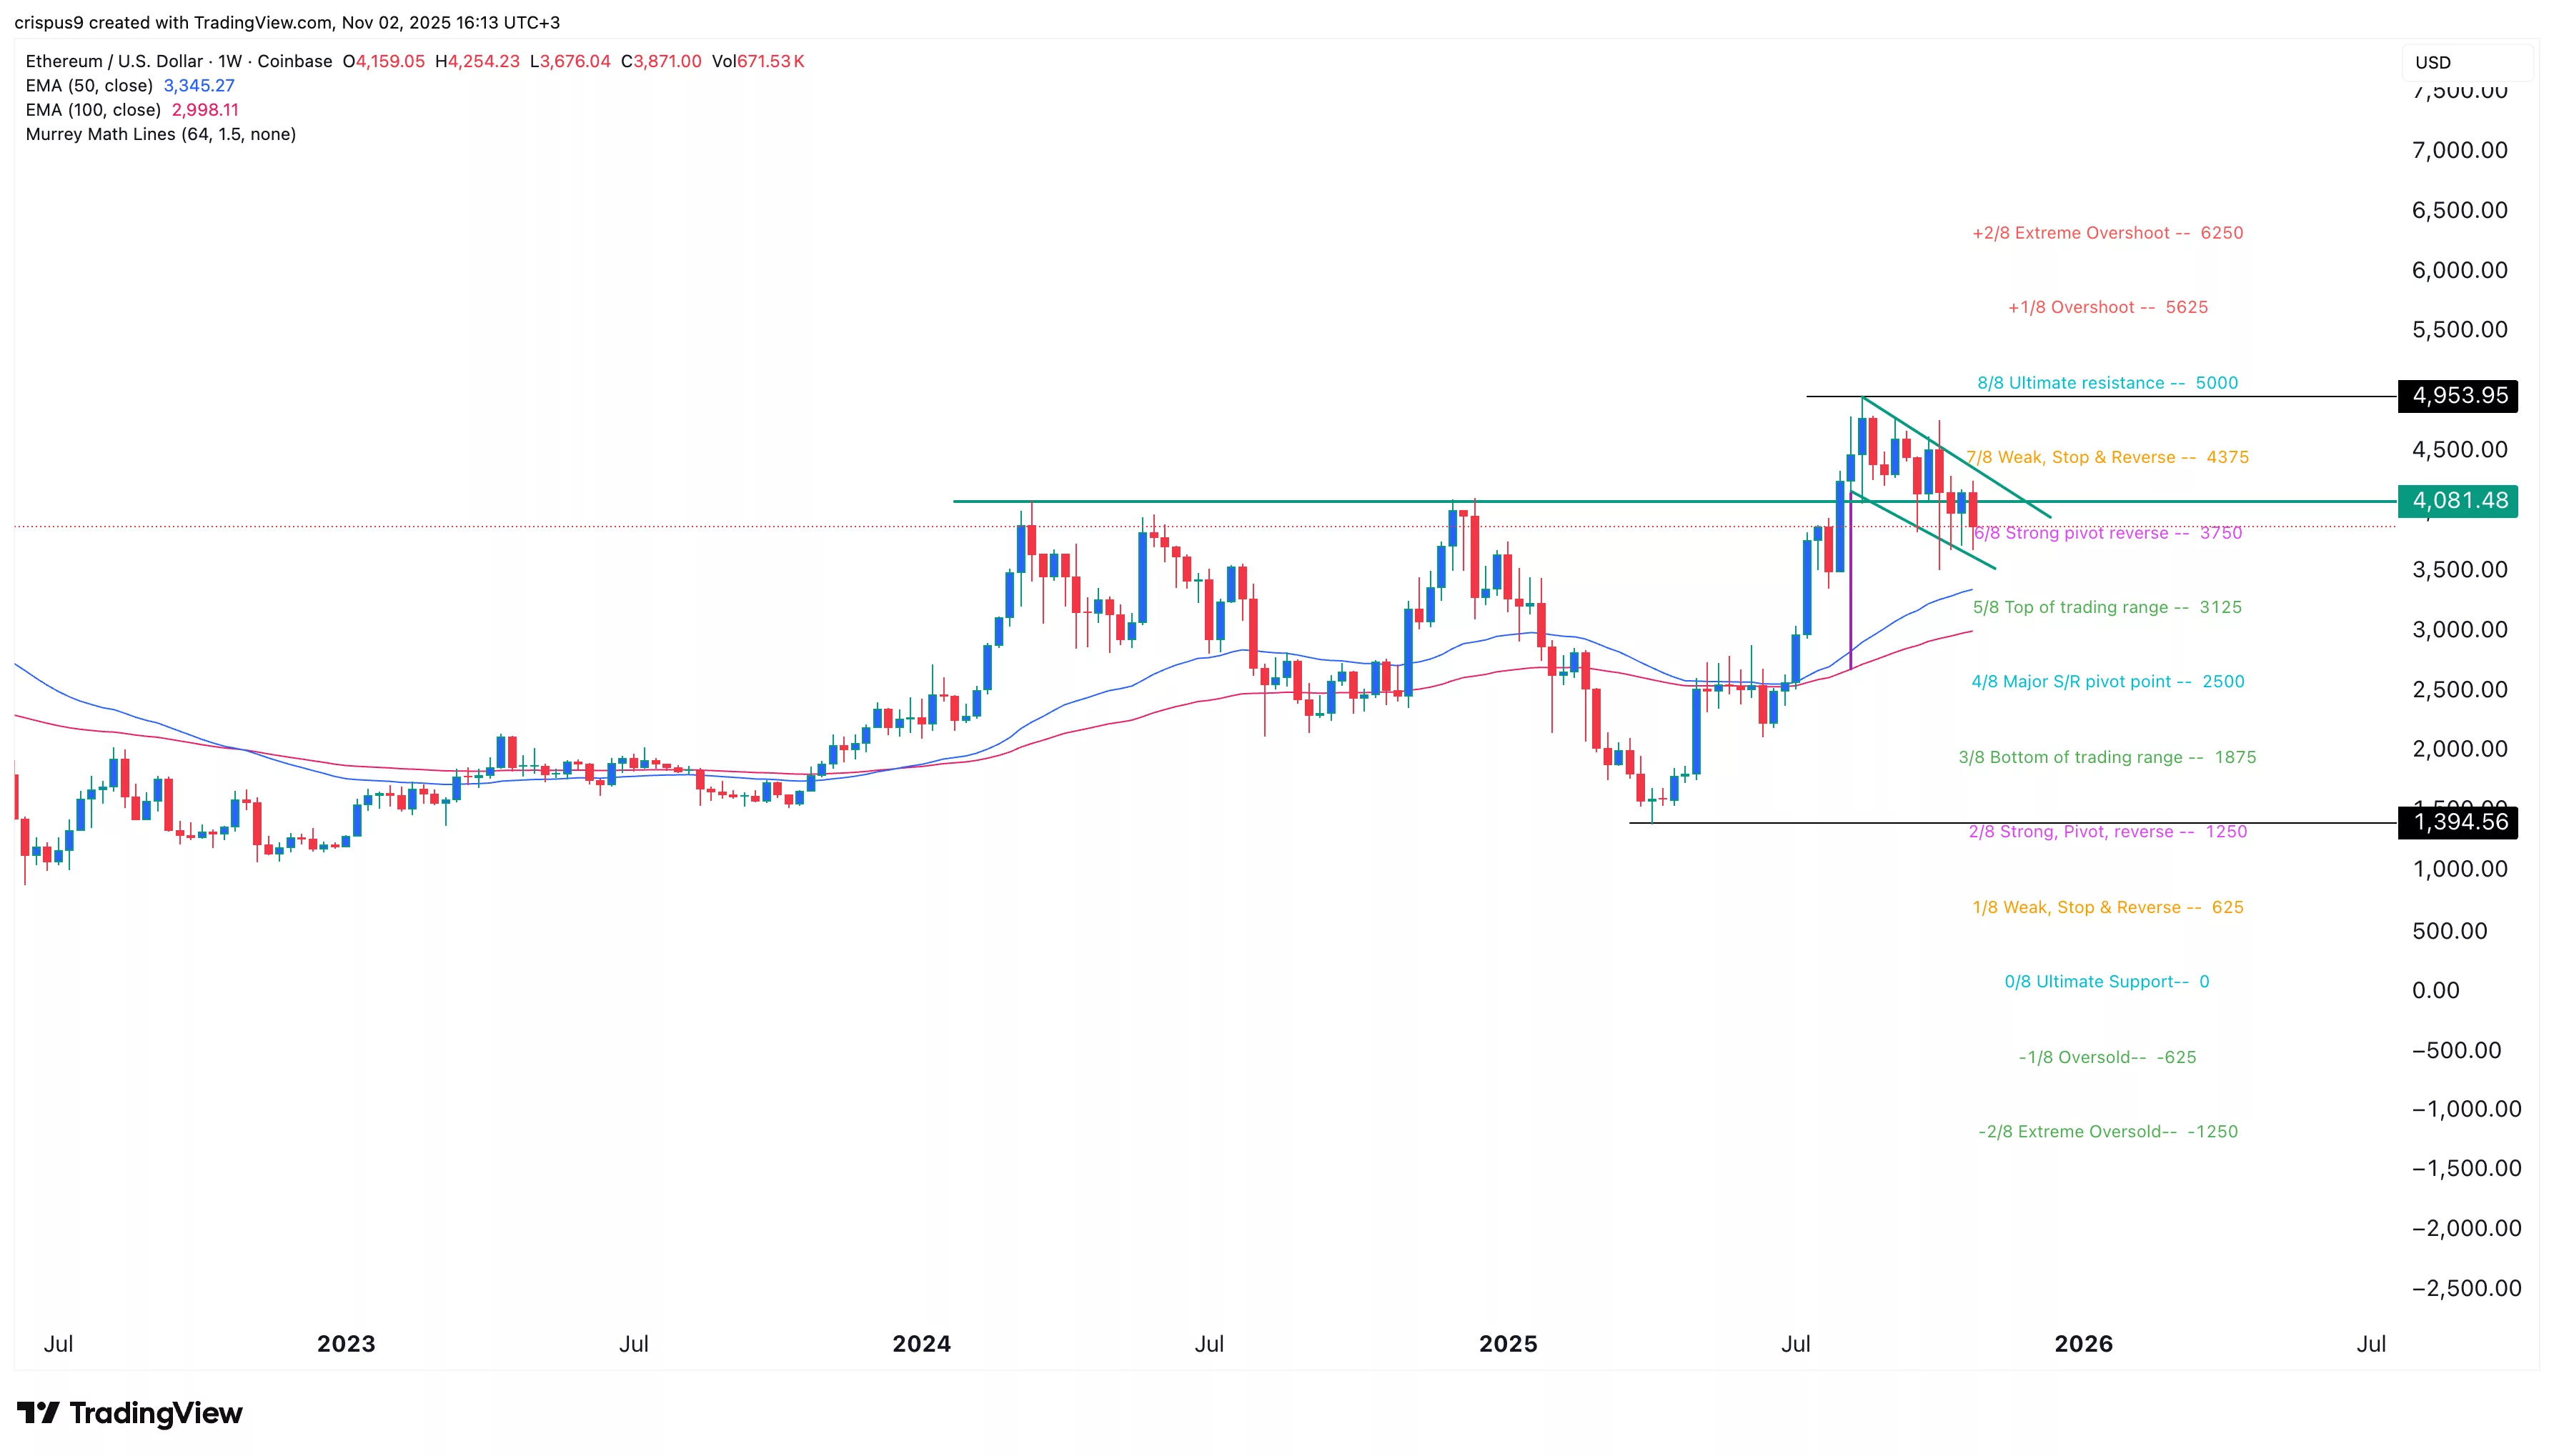
Ethereum price chart |Source: crypto.news
The weekly chart shows that ETH price has recovered from an April low of $1,394 to a September high of $4,953. It remains above the 50-week and 100-week exponential moving averages that formed a bullish crossover in June.
Ethereum price is also forming a bullish flag pattern consisting of a vertical line and a descending channel. It also retested the key support level at $4,080, the high of last March and December.
ETH price is also in the second phase of the Elliott Wave pattern, followed by a bullish third phase.
Therefore, the most likely scenario is a pullback, which could eventually result in resistance to $5,000 on the Murray Math Line.
read more: Coinbase wants a piece of the stablecoin pie, enters late-stage talks with BVNK


