
Ethereum price appears to be losing momentum due to slowing trading activity and declining investor confidence.
summary
- Ethereum price is trading near support, down 30% from its all-time high.
- DEX volumes and TVL continue to decline across the Ethereum network.
- Spot ETH ETFs saw outflows of $107 million, indicating weak investor demand.
At the time of writing, Ethereum was trading at $3,448, down about 3% in the past 24 hours. Last week, the price hovered between $3,216 and $3,633, down 16% over the last month and now 30% below August’s all-time high of $4,946.
Trading activity slowed. Ethereum (ETH) 24-hour trading volume decreased by 12% from the previous day, indicating a decline in market interest. Derivative trading volume fell 7.5% to $74.95 billion, and open interest fell 3.4% to $38.74 billion, according to CoinGlass data. This indicates that market activity has cooled down after the recent volatility and traders are taking fewer new positions.
ETFs record outflows, DeFi activity weakens
Ethereum’s on-chain numbers are showing a steady slowdown. Monthly trading volume on decentralized exchanges fell from $128 billion in August to $103 billion in September and $99 billion in October, according to DeFiLlama data. The total amount locked has also decreased from about $85 billion in late October to $75 billion at the time of writing.
You may also like: Ethereum Price Prediction: Could Volatility Squeeze Below $3,600?
This drop in liquidity and trading shows that investors are becoming more cautious. Although there are still around 16 million active Ethereum addresses, fewer funds are moving through DeFi platforms, suggesting fewer participants and weaker demand.
Adding to the strain, $107.39 million was withdrawn from the U.S. Spot Ethereum ETF on November 11, according to SoSoValue data. In contrast, $532 million was invested in Bitcoin ETFs on the same day, suggesting that institutional investors currently prefer Bitcoin over Ethereum.
However, some financial firms such as Bitmine continue to add Ethereum to their holdings, indicating that long-term investors remain optimistic about Ethereum’s prospects.
Ethereum price technical analysis
Ethereum’s chart paints a cautious picture. The MACD is still slightly negative, suggesting that sellers still have the upper hand in the short term, while the relative strength index is at 40, indicating neutral to weak momentum.
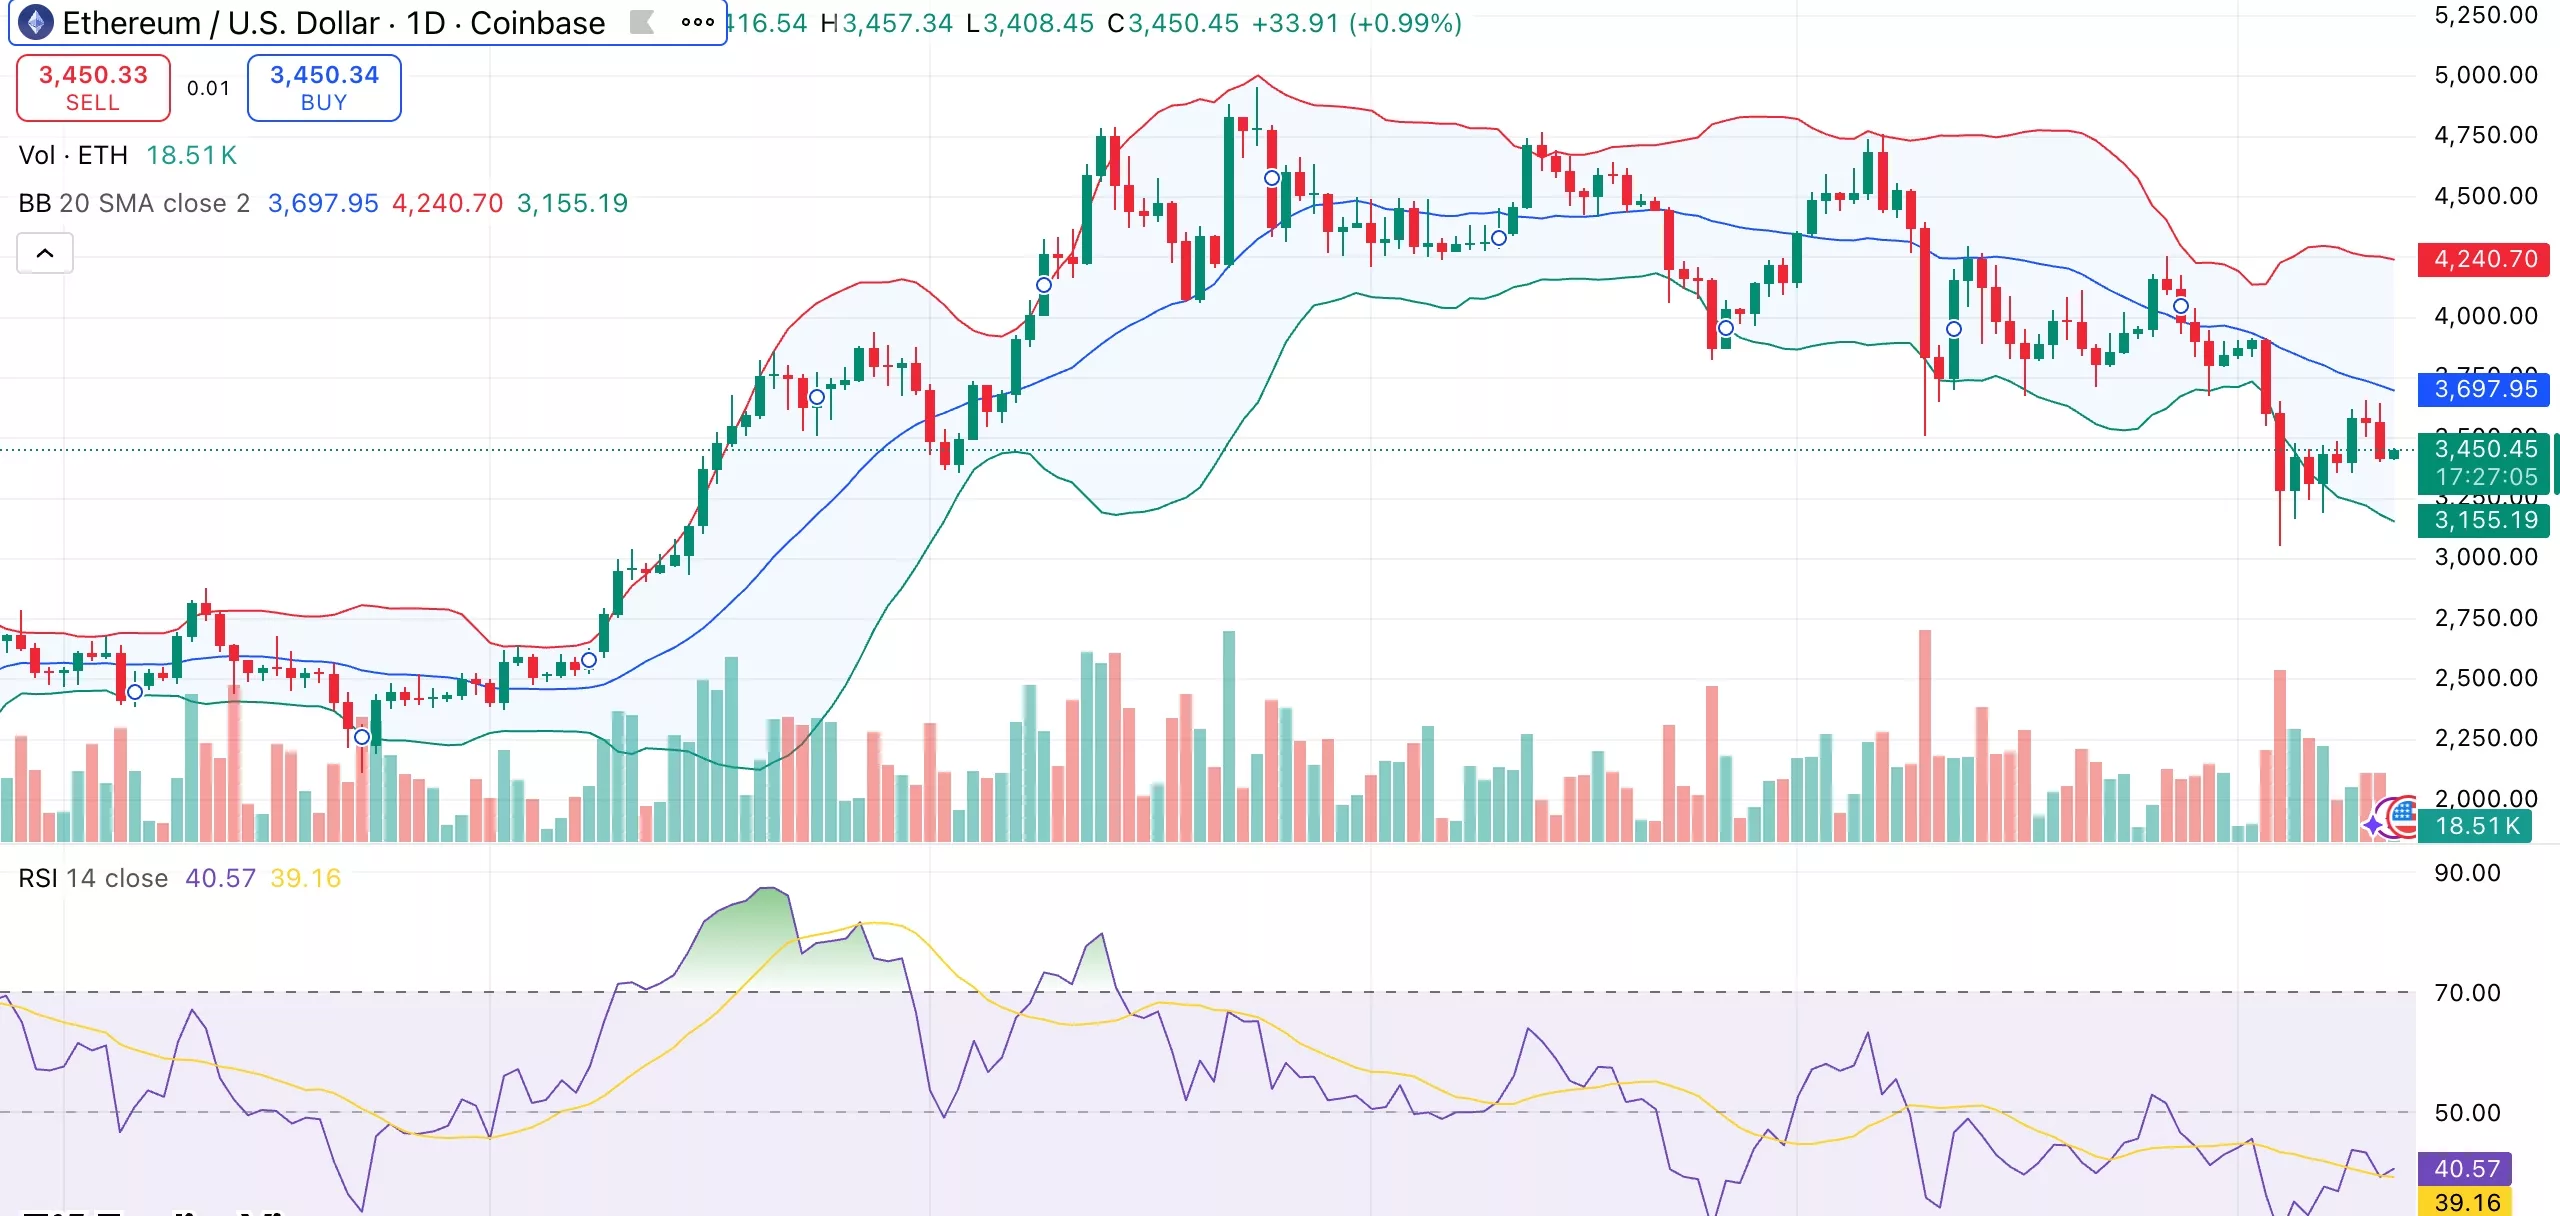
Ethereum daily chart. Credit: crypto.news
Ethereum is currently trading near the middle of the Bollinger Bands, with resistance between $3,520 and $3,700. The support price is located around $3,300, a level where buyers often intervene.
If ETH breaks below this level, the next major support could be around $3,150 to $3,200. On the other hand, a strong move above $3,700 could push the price towards $3,850-$4,000.
read more: Bitwise’s Chainlink ETF makes DTCC debut as LINK price drops 5%


