
After the Bitcoin price crashed below $100,000 in November, various bearish predictions began to circulate in the crypto community. For some, this crash means the end of the bull market and the arrival of the dreaded bear market. While some predictions are conservative, pegging the Pioneer cryptocurrency’s bottom at around $50,000, one analyst in particular is predicting an even more severe crash, and this was done using gold charts.
Why is there a possibility of a collapse in Bitcoin price?
Crypto analyst The Great Martis shared his predictions on where Bitcoin price will go next on X (ex-Twitter). This chart shows a potential downside for Bitcoin that could drop below $20,000 and eventually bottom out around $15,000. It’s not unusual for analysts to predict such a crash, but what’s interesting is why Mattis believes it’s possible.
The cryptocurrency analyst said the performance of gold, which saw the asset hit an all-time high this year, was driven by speculation. Martis explains that Fed intervention will continue to push the price of gold higher, which in turn could push down the price of Bitcoin.
Furthermore, analysts expect gold prices to rise to the $12,000 region, the same region as Bitcoin prices in 2021. An interesting thing to note about Bitcoin in 2021 is that this year was the digital asset’s most explosive year ever.
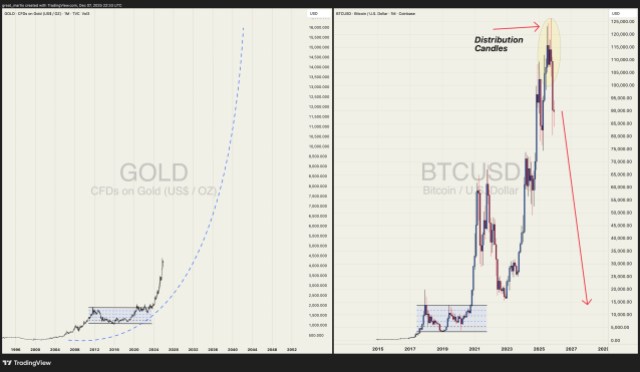
If Bitcoin continues to perform inversely to gold, a rise in gold to five digits would mean a bear market for Bitcoin. A crash to $15,000 would mean the price would be down more than 70% from current levels and almost 90% from its all-time high of $126,000.
So far this year, gold has performed better when comparing the two side by side. By the way, gold prices have already increased by more than 55% in 2025. meanwhile, Bitcoin price drops by 30% After reaching $126,000 in October, the price has increased.
Both of these assets continue to lead in their respective sectors, but gold remains the standard for what investors consider a “safe” investment compared to Bitcoin, which is known for its volatile prices.
Featured image from Dall.E, chart from TradingView.com


