
Bitcoin price has started a new rally above $90,500. BTC is currently consolidating its gains and could attempt an upside break above $91,650.
- Bitcoin has started a new rally above the $90,500 zone.
- The price is trading above $91,000 and the 100-hour simple moving average.
- On the hourly chart of the BTC/USD pair (data feed from Kraken), the pair has broken above the major bearish trend line with resistance at $90,000.
- If it settles above the $91,650 zone, the pair could continue moving higher.
Bitcoin price faces resistance
Bitcoin price managed to stay above the $90,500 zone, new increase. BTC gained momentum towards a rally above the $91,500 and $92,500 levels.
There was a clear move above the $93,000 resistance. The high was formed at $94,050, and the price has recently corrected slightly. make a profit. There was a decline below the 50% Fib retracement level of the bull market from the swing low of $83,871 to the high of $94,050.
However, bulls were active around the $87,800 support and the 61.8% Fib retracement level of the rally from the swing low of $83,871 to the high of $94,050. The price is again over $90,000.
On the hourly chart of the BTC/USD pair, the pair broke above the major bearish trend line with resistance at $90,000. Bitcoin is currently trading above $91,000 and its 100-hour simple moving average.
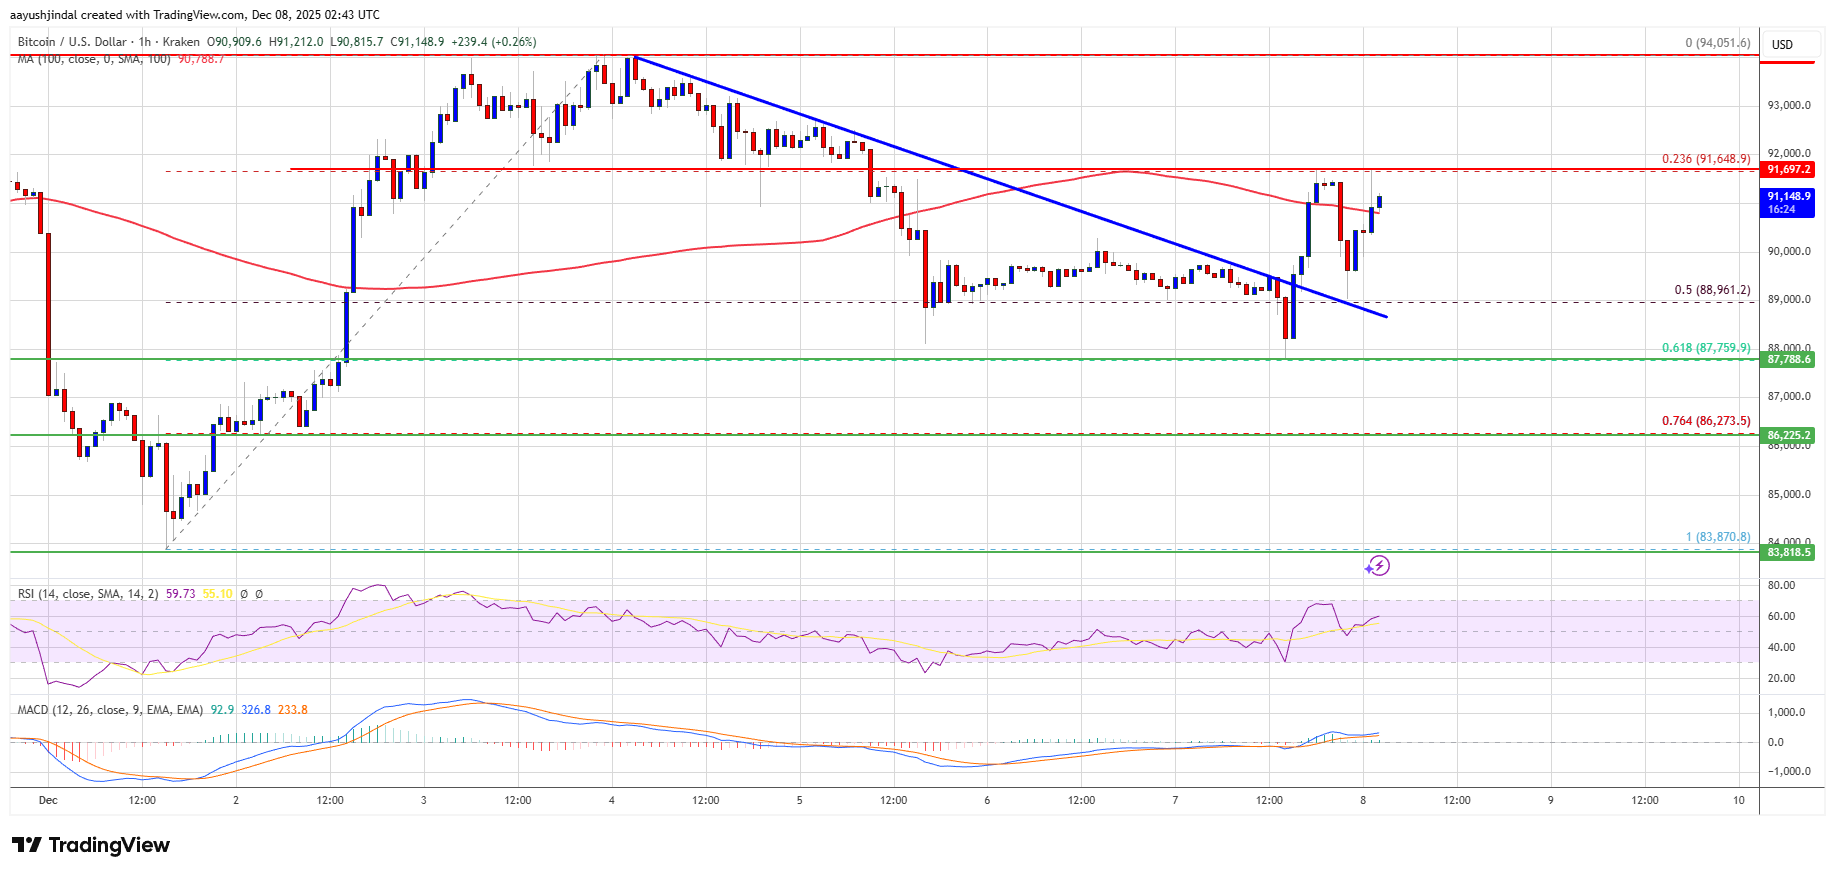
If the bulls continue their action, the price could try to move higher. Immediate resistance is near the $91,650 level. The first major resistance level is near the $92,000 level. The next resistance level could be at $93,000. If the price closes above the $93,000 resistance level, the price could move higher. In the above case, the price may rise and test the $95,000 resistance. Any further rise could push the price closer to the $95,500 level. The next hurdles for the bulls could be $96,200 and $96,450.
Will BTC fall again?
If Bitcoin fails to rise above the $91,650 resistance zone, further decline could begin. Immediate support is near the $90,000 level. The first major support is near the $89,500 level.
The next support is currently located near the $87,800 zone. Any further losses could send the price towards the $87,250 support in the near term. The main support lies at $86,500, below which BTC could accelerate its decline in the short term.
Technical indicators:
Hourly MACD – The MACD is currently pacing in the bullish zone.
Hourly RSI (Relative Strength Index) – BTC/USD’s RSI is currently above the 50 level.
Major support levels – $90,000, then $89,500.
Key resistance levels – $91,650 and $92,000.


