
A widely shared snapshot of seasonality is making headlines before the end of the month. This is a Coinglass heat map of Bitcoin monthly returns, reposted by trader Daan Crypto Trades. This table spans from 2013 to 2025 and shows November as a statistical outlier in Bitcoin’s calendar, with certain years seeing impressive gains and steep drawdowns.
Bitcoin November Preview
“Based on historical performance, November is the best month for Bitcoin so far,” Dern wrote on X, noting that the average change in November across the dataset was +46.02%. This figure is clearly skewed by the +449.35% surge in November 2013, which was the biggest monthly price move on the board. He further added, “The average gain for all these months is +46.02%. However, this is heavily skewed by a single monthly gain in November 2013. Bitcoin was +449.35% for that month!!”
The actual numbers support the reputation without exaggeration. Of the 12 Novembers listed (2013-2024), 8 finished in green. 2013 (+449.35%), 2014 (+12.82%), 2015 (+19.27%), 2016 (+5.42%), 2017 (+53.48%), 2020 (+42.95%), 2023 (+8.81%), 2024 (+37.29%) – of which 4 years are negative – 2018 (-36.57%), 2019 (-17.27%), 2021 (-7.11%), 2022 (-16.23%).
Related books
The median change in November is +10.82%, with a more conservative central tendency and weakening the 2013 effect. Excluding 2013 entirely, the simple average for November drops to approximately +9.35% over the remaining 11 years, highlighting how a single month can distort average-based seasonality.
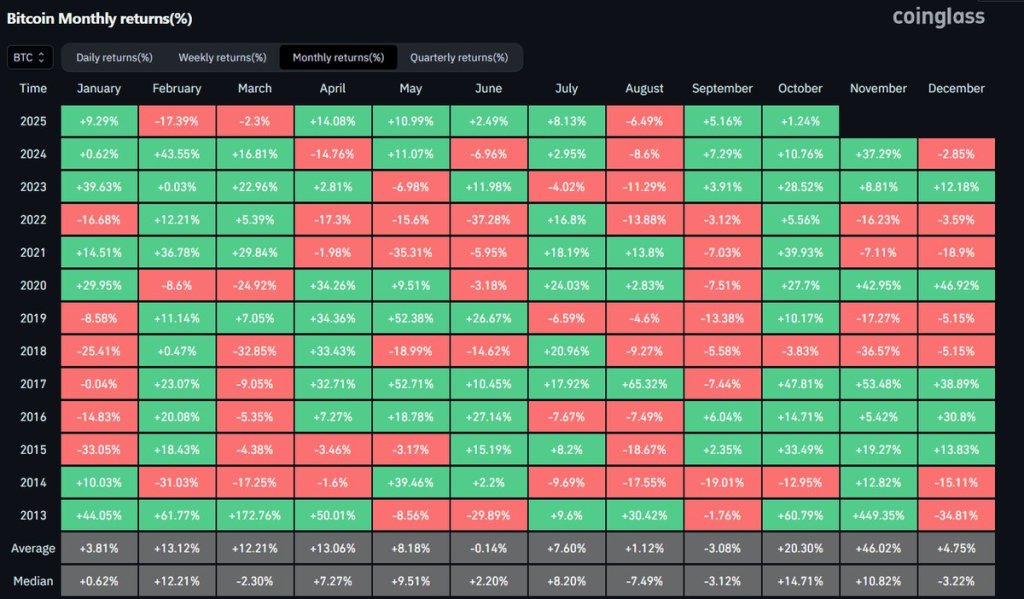
The broader table context is important. While November’s average is the highest of any month on Coinglass’ grid, exceeding October’s average of +20.30%, December shows a much more mixed profile with an average of +4.75% and a median of -3.22%, an imbalance consistent with an outlier-driven month.
September has long been criticized by traders, but it has maintained a negative average (-3.08%) over the entire period. The 2024 line itself captures the narrative push and pull of this cycle. Double-digit gains in February, March, May, October, and November were offset by significant declines in April, June, and August, with December ending the year negative (-2.85%).
Lessons from previous cycles
Daan’s framework goes beyond simple seasonality. “November and December are when the 2013, 2017 and 2021 cycles reached their peaks. This is also when the 2018 and 2022 cycles bottomed out,” he noted. This observation is consistent with a historical inflection point that most market participants remember. Namely, the late 2013 mania and subsequent crash, the December 2017 peak, and All-time high in November 2021and washouts in December 2018 and November 2022.
Related books
Although the Coinglass grid cannot timestamp intra-month highs and lows, the concentration of major pivots in the last two months of the year is consistent with market lore and with a return pattern that shows both exceptionally strong up months and the most severe down months of the cycle during this window.
The actual point, again from Mr. Dern, is that assertive bullishnessbut regime risk: “Overall, generally speaking, the last two months of the year have been eventful. Volatility and major market reversals, whether on the bull or bear side, are the theme heading into the end of the year.” Heat maps help characterize that.
November’s distribution spanned the widest range of extremes on record, from a high of +449.35% to a low of -36.57%, with a green month hit rate of two-thirds and a median increase in the low double digits. In contrast, December produced both a cycle top and a cycle bottom despite a lower average, a reminder that mean and median statistics can obscure the path risk that defines Bitcoin’s fourth quarter.
Seasonality is not destiny and samples are limited. Still, the data-backed message is clear. As November approaches, Bitcoin historical pattern The emphasis is on fluctuations rather than quiet continuations of trends, of the kind that characterize both euphoric outbursts and surrender.
At the time of writing, BTC was trading at $114,487.
Featured image created with DALL.E, chart on TradingView.com


